
Dans cette rubrique
- Générer une présentation beamer et un article à partir d’un même contenu - 5 novembre 2008
- Macros LaTeX et graphiques pgf/tikz - 19 septembre 2009
- Tikz : plot de fonction et nouvelle version de gnuplot (4.4.0) - 21 mai 2011
- Racine cubique, tikz et gnuplot - 8 octobre 2016
- Graphe de fonction automatique - 3 janvier 2018
Graphe de fonction automatique
Il suffit de définir les coordonnées du point inférieur gauche et du point supérieur droit pour que le repère cartésien soit automatiquement créé.
L’idée est de "juste" définir les coordonnées des sommets respectivement inférieur gauche et supérieur droit du repère où la fonction doit venir se dessiner.
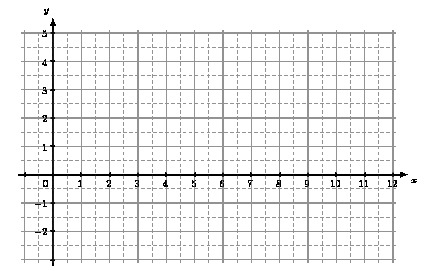
- Repère cartésien avec tikz
Voici le code :
\documentclass[border=5pt]{standalone}

%%%<

\usepackage{verbatim}

%%%>

% \usepackage{pgfplots}

% \pgfplotsset{compat=1.8}

\usepackage{amsmath}

\usepackage{tikz}

 \usetikzlibrary{calc}


\begin{document}

%    \begin{center}

          \pgfmathtruncatemacro\xmin{-1}

          \pgfmathtruncatemacro\xmax{12}

          \pgfmathtruncatemacro\ymin{-3}

          \pgfmathtruncatemacro\ymax{5}

          %

                \begin{tikzpicture}[>=latex,scale=1]

                    \draw[very thin,dashed, xstep=0.5, ystep =0.5, color=gray]  ($(\xmin,\ymin) + (-0.1,-0.1)$)  grid ($(\xmax,\ymax) + (0.1,0.1)$) ;

                    \draw[thin,color=gray] ($(\xmin,\ymin) + (-0.1,-0.1)$)  grid ($(\xmax,\ymax) + (0.1,0.1)$) ;

                    %

                    \draw[very thick, ->]  ($(\xmin,0) + (-0.2,0)$)  -- ($(\xmax,0) + (0.5,0)$) node[below right] {$n$};

                    \draw[very thick, ->]  ($(0,\ymin) + (0,-0.2)$)  -- ($(0,\ymax) + (0,0.5)$) node[above left] {$u_n$};

                    %

                    \pgfmathtruncatemacro\xminPlus{\xmin + 1}

                    \pgfmathtruncatemacro\xminPlusDbl{\xminPlus + 1}

                    %

                    \draw[very thick] (\xmin,2pt) -- (\xmin,-2pt);

                    \foreach \x in {\xminPlus,\xminPlusDbl,...,\xmax }{

                        \ifnum\x=0

                          \draw[very thick] (\x,2pt) -- (\x,-2pt)  node[below left, xshift= -0.035cm ] {$\x$} ;

                        \else

                          \draw[very thick] (\x,2pt) -- (\x,-2pt) node[below , xshift= -0.035cm ] {$\x$} ;

                        \fi

                        }

                      %

                        %

%                     \foreach \xpi in {-2,-1,...,2}

%                         \draw[very thick] ({3*\xpi},-2pt) node[below, xshift= -0.007cm ] {${\xpi} \pi$} ;

                        %

                    \pgfmathtruncatemacro\yminPlus{\ymin + 1}

                    \pgfmathtruncatemacro\yminPlusDbl{\yminPlus + 1}

                           \draw[thick] (2pt,\ymin) -- (-2pt,\ymin);

                    \foreach \y in {\yminPlus,\yminPlusDbl,...,\ymax}{

                        %

                        \ifnum\y=0

                          \draw[very thick] (2pt,\y) -- (-2pt,\y);

                        \else

%                          \pgfmathsetmacro\ySurDeuxEtDemi{2*\y/5}

%                           \draw[very thick] (2pt,\y) -- (-2pt,\y) node[ left, yshift= -0.035cm ] {$\pgfmathprintnumber\ySurDeuxEtDemi$} ;

                           \draw[very thick] (2pt,\y) -- (-2pt,\y) node[ left, yshift= -0.035cm ] {$\y$} ;

                        \fi

                        }

                    %

                    %

                      \pgfmathsetmacro\xMinGraphe{\xmin +0.5}

                    %

                      \pgfmathsetmacro\xMaxGraphe{\xmax -0.5}

                    %

%                     \draw[very thick,color=black!40!green!90] plot[samples=200,domain=\xMinGraphe:\xMaxGraphe] (\x,{(3/2)*sin((2*\x  +3.1/3)*(180/3)) +2});

                    %

%                     \draw [pattern color = green, pattern = dots] plot[samples=200,domain=-1.5:2.9]

%                               (\x,{(2*\x +3)^(1/2)}) -- plot[domain=2.9:-1.5] (\x,{2*\x -3}) ;

%                     \draw[thick, dashed, color =orange] (-4,1) -- (4,1) node[above right] {$d \equiv y =1 $};

                \end{tikzpicture}

%    \end{center}


\end{document}
Documents joints
 Les sources, LaTeX, 2.5 ko
- Podcast et RSS
- Plan
- Contact
- Mentions
- Aide
- Rédaction
- Se connecter

-
2004-2025 © @YvesDelhaye.Be : "Nous ne sommes pas faits pour vivre comme des imbéciles, mais pour suivre les chemins de la vertu et de la connaissance." (Dante : l’Enfer) - Tous droits réservés
Ce site est géré sous SPIP 2.1.28 [22259] et utilise le squelette EVA-Web 4.1

Dernière mise à jour : mercredi 1er février 2023