
Dans cette rubrique
- Générer une présentation beamer et un article à partir d’un même contenu - 5 novembre 2008
- Macros LaTeX et graphiques pgf/tikz - 19 septembre 2009
- Tikz : plot de fonction et nouvelle version de gnuplot (4.4.0) - 21 mai 2011
- Racine cubique, tikz et gnuplot - 8 octobre 2016
- Graphe de fonction automatique - 3 janvier 2018
Mots-clé
Macros LaTeX et graphiques pgf/tikz
Exemple sur example.net
Automatiser la création de graphiques par l’ utilisation de macros LaTeX.
Si vous créez des graphiques de fonction via une interface graphique et que vous décidez de changer de couleur, d’ échelle, de fonctions... Il vous faudra refaire toutes vos illustrations une par une. Pas si vous utilisez les macros LaTeX !
Cet exemple a été accepté sur texample.net (anciennement fauskes.net)
% under Creative Commons attribution license.
% A work by Yves Delhaye
% Requires GNUPLOT and shell-escape enabled
\documentclass{minimal}
\usepackage{tikz}
\usetikzlibrary{arrows,shapes}
\usepackage{xifthen}
\begin{document}
% Macros for cst. They have to be redefined each time. See inside document
\newcommand{\cA}{1}% Cste . fct
\newcommand{\cB}{0}% Cste + fct
\newcommand{\cC}{1}% Cste . var
\newcommand{\cD}{0}% Cste + var
%LaTeX Macro for drawing fct with pgf/tikz. Define once, use many!
\newcommand{\FctAss}{
\begin{tikzpicture}[domain=0:8]
\pgfmathparse{0.1+\cA*1.1 +\cB} \pgfmathresult \let\maxY\pgfmathresult% evaluate maxY
\pgfmathparse{-0.1-\cA*1.1 +\cB} \pgfmathresult \let\minY\pgfmathresult% evaluate minY
\pgfmathparse{\maxY < 1} \pgfmathresult \let\BmaxY\pgfmathresult% What if maxY < 1? Then set Boolean to 1
\ifthenelse{\equal{\BmaxY}{1.0}}{%
\pgfmathparse{1.2} \pgfmathresult \let\maxY\pgfmathresult% Correct maxY to have correct graph
}{}
\pgfmathparse{\minY > 0} \pgfmathresult \let\BminY\pgfmathresult% What if minY > 0? Then set Boolean to 1
\ifthenelse{\equal{\BminY}{1.0}}{%
\pgfmathparse{0} \pgfmathresult \let\minY\pgfmathresult% Correct minY to have correct graph
}{}
% DRAW the graph of the function from here on
\draw[very thin,color=gray] (-0.1,\minY) grid (7.9,\maxY);% GRID use minY & maxY
\draw[->] (-0.2,0) -- (8.2,0) node[right] {$x$};
\draw[->] (0,\minY) -- (0,\maxY) node[above] {$f(x)$};% y axis use minY & maxY too
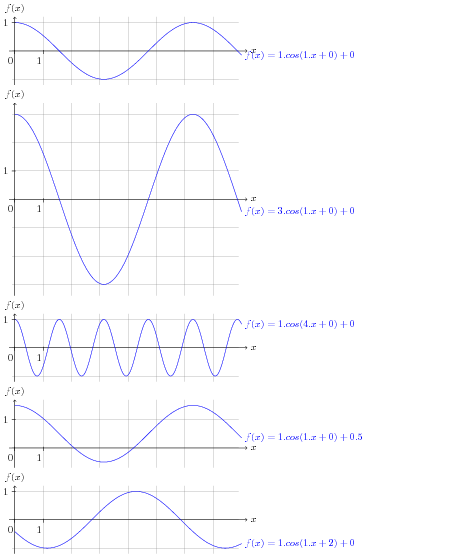
\draw[smooth,samples=200,color=blue] plot function{(\cA)* (cos((\cC)*x+(\cD))) + \cB}
node[right] {$f(x) = \cA{} . cos(\cC{} . x + \cD{}) + \cB{}$};
% units for cartesian reference frame
\foreach \x in {0,1}
\draw (\x cm,1pt) -- (\x cm,-3pt)
node[anchor=north,xshift=-0.15cm] {$\x$};
\foreach \y/\ytext in {1}
\draw (1pt,\y cm) -- (-3pt,\y cm) node[anchor=east] {$\ytext$};
\end{tikzpicture}
}
% END of macro
% And now use it!
\FctAss{}
% Change the parameters
\renewcommand{\cA}{3}
\renewcommand{\cB}{0}
\renewcommand{\cC}{1}
\renewcommand{\cD}{0}
% WITHOUT rewriting the code for the picture
\FctAss{}
%
% And do it again
\renewcommand{\cA}{1}
\renewcommand{\cB}{0}
\renewcommand{\cC}{4}
\renewcommand{\cD}{0}
\FctAss{}
% And again
\renewcommand{\cA}{1}
\renewcommand{\cB}{0.5}
\renewcommand{\cC}{1}
\renewcommand{\cD}{0}
\FctAss{}
% And again
\renewcommand{\cA}{1}
\renewcommand{\cB}{0}
\renewcommand{\cC}{1}
\renewcommand{\cD}{2}
\FctAss{}
% UNCOMMENT IF YOU WANT TO SEE MORE
% % This is where the test on maxY is useful.
% \renewcommand{\cA}{3}
% \renewcommand{\cB}{-14}
% \renewcommand{\cC}{2}
% \renewcommand{\cD}{-2}
%
% \FctAss{}
%
% % And here the test on minY is useful.
% \renewcommand{\cA}{3}
% \renewcommand{\cB}{14}
% \renewcommand{\cC}{2}
% \renewcommand{\cD}{-2}
%
% \FctAss{}
%
\end{document}Voir en ligne : Voir www.texample.net
portfolio
 Document
 Document
- Podcast et RSS
- Plan
- Contact
- Mentions
- Aide
- Rédaction
- Se connecter

-
2004-2025 © @YvesDelhaye.Be : "Nous ne sommes pas faits pour vivre comme des imbéciles, mais pour suivre les chemins de la vertu et de la connaissance." (Dante : l’Enfer) - Tous droits réservés
Ce site est géré sous SPIP 2.1.28 [22259] et utilise le squelette EVA-Web 4.1

Dernière mise à jour : mercredi 1er février 2023